
FRAMR. Dashboard for measurable metrics
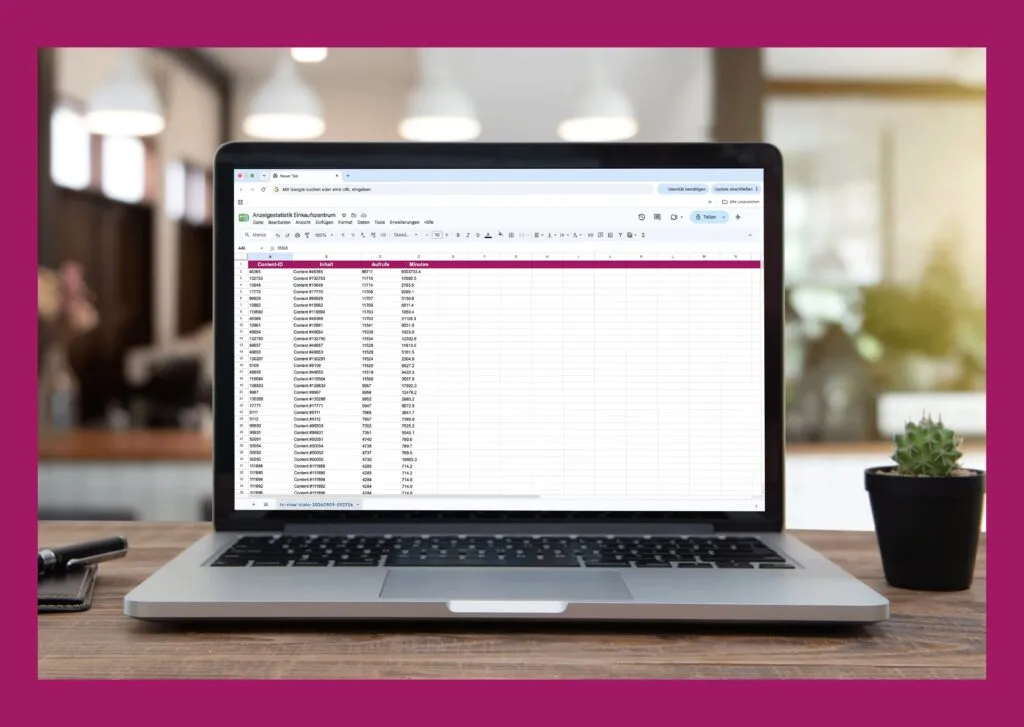
The FRAMR. statistics view tracks exactly which content was displayed, when, for how long and on which player. This allows your company to benefit from verifiable metrics and data collection for market research purposes.
FRAMR. Dashboard and statistics view: An overview of all features
Verifiable metrics for your business
You can see how often and for how long each piece of content was displayed at each location. This allows you to verify metrics with precision, rather than relying on estimates.

Market research through data collection
If your directory is frequently searched for locations, stores or terms that don’t actually exist, this isn’t a technical problem — it’s a valuable insight: Visitors are looking for an offering that’s (still) missing. The statistics view shows you exactly these unsuccessful search queries, including the frequency and the specific terms used to search for individual listings or navigation destinations.

Transparent communication structures
Transparent communication structures provide a reliable basis for decision-making. Based on the key metrics, you can, for example, objectively assess whether advertising campaigns are effective or not. And when renting out ad placements, you can provide your advertising clients with proof of how often ads for their company are displayed.

Data exports in common formats
All statistical data can be exported and reused in Excel, reporting tools or directly in a client report — without having to manually transfer values. The export itself is done manually with a single click.
All locations at a glance
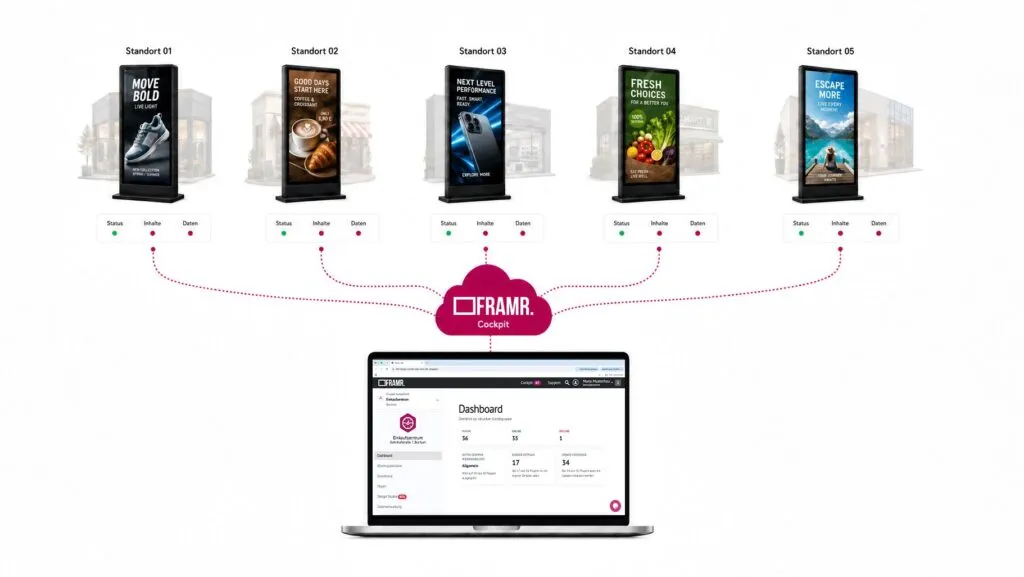
Instead of checking each player individually, the group dashboard lets you view multiple locations at once in a centralized overview. This saves time as soon as you have more than a handful of displays in use.
FAQ
Frequently asked questions about our solutions.
Our software is hosted in the cloud to enhance reliability and ensure 24/7 continuous operation. In addition, our digital signage solutions comply with GDPR requirements. You can find more information here.
No. Monitoring shows the operational status of your players — online/offline, temperature, storage space. The statistics view provides a content analysis: It shows what was displayed on the screens, how often and for how long.
Yes. Since each ad is tracked by frequency, duration and location, it is possible to verify exactly whether an agreed-upon airtime was adhered to.
There is no limit as such. However, after one year, data is aggregated on a daily basis to save storage space.
It is possible to set up interfaces for this process.
Yes, the analysis of search queries and navigation destinations is based on data from the Directory module. Without the Directory module, you’ll still see the display statistics for content, but not the search data.
Would you like a clear assessment of how you can use digital signage?
No sales pitch, just an assessment: What are your goals, what does your current setup look like and what are the challenges? Based on our experience from numerous projects, we’ll tell you — with no obligation — what makes sense for your specific use case.

Lukas Aumair
CEO & sales

Pascal Kreilhuber
Sales

Clemens Stübler
Sales

Michael Thalmann
Sales